
![]()
Are you planning to invest in the stock market but unsure how to evaluate whether a stock is good or bad? Heard about a company but don’t know its financial condition? Or perhaps you’re investing just because others are—without understanding the business?
If these questions often cross your mind, you’re not alone. In investing, knowing the right information is just as important as knowing how to analyze it. That’s where financial ratios come in—helping investors assess the true quality of a company.
Let’s dive into how financial ratios assist in stock analysis.

Investing Today: Easier but Riskier
Investing has become more accessible than ever. But determining which stock is fundamentally sound is still the biggest challenge. With thousands of listed companies in the market, picking the right one often feels like finding a needle in a haystack.
Financial ratios simplify this challenging process. These are mathematical indicators that offer a clear view of a company’s financial status, profitability, debt burden, and competitive positioning.
In this blog, we’ll walk you through the 5 most essential financial ratios every smart investor must understand before investing confidently.
Why Financial Ratios Matter!
Relying solely on news, stock tips, or social media hype to make investment decisions is risky. A prudent investor should focus on the internal financial strength of a company. While annual reports and financial statements may seem complex, financial ratios simplify and summarize the key insights.
What can financial ratios help you understand?
- Whether a company is generating profit
- The extent of its debt burden
- If the stock is overvalued or undervalued
- Business efficiency
- How it compares to peers in the same industry
Also Read: Why You Should Only Take Financial Advice from a SEBI-registered Investment Advisor
To analyze these important aspects, one of the most commonly used ratios is –
1. Price-to-Earnings (P/E) Ratio
The P/E Ratio shows how much you’re willing to pay for ₹1 of the company’s earnings. It’s a key valuation metric to determine whether a stock’s current price is justified by its profits.
A high P/E suggests that the market expects strong future earnings and is optimistic about the company’s growth. A low P/E may indicate the stock is undervalued—or that the market is unsure about its prospects.

Example:
If ABC Ltd has a market price of ₹200 and EPS of ₹10, then its P/E Ratio is 20—meaning you’re paying ₹20 for every ₹1 of earnings.
In contrast, if XYZ Ltd has a price of ₹400 and EPS of ₹40, the P/E Ratio is 10, indicating a better value for earnings.
However, to truly understand whether a stock is over or underpriced, always compare with other companies in the same industry.
Also Read: How to Build a Stock Market Portfolio? Learn These 9 Essential Steps
2. Return on Equity (RoE)
RoE measures how efficiently a company generates profit from the capital invested by its shareholders. It’s a crucial profitability ratio that reflects the management’s effectiveness.
A higher RoE generally signals better capital utilization. But beware—companies with low equity and high debt may show artificially high RoE.

Example:
If Company A earns ₹100 crore in profit with ₹500 crore in equity, RoE is 20%.
If Company B earns ₹150 crore with ₹1500 crore equity, RoE is only 10%.
This indicates Company A is using its equity more efficiently.
Still, RoE must be viewed along with Debt-to-Equity Ratio to avoid misinterpretation due to high leverage.
Also Read: Undervalued or Underperforming? A Deep Dive into Two Falling P/E Stocks
3. Price-to-Book (P/B) Ratio
The P/B Ratio tells you how much you are paying for each rupee of a company’s net assets (book value). Book Value is what would be left for shareholders if all assets were sold and liabilities paid off.
A P/B below 1 suggests that the stock is undervalued. A P/B above 1 implies the market sees future profitability or stability in the company and is willing to pay a premium.

Example:
If Company A has a market price of ₹150 and a book value of ₹100, the P/B is 1.5 — considered fairly valued.
But Company B with a price of ₹80 and book value of ₹100 has a P/B of 0.8 — possibly undervalued.
Peer comparison within the same industry is essential for accurate interpretation.
Also Read: The Regulatory Backbone of India’s Capital Market
4. Dividend Yield
Dividend Yield measures the annual return (in %) you get as dividend relative to the stock price. This is vital for income-focused investors, such as retirees or long-term holders seeking regular income.
A high dividend yield suggests the company consistently rewards shareholders. But be cautious—financially weak companies may also offer high dividends to retain investor interest.

Example:
If ABC Ltd pays ₹10 annually as dividend and its stock trades at ₹200, the Dividend Yield is 5%.
Besides yield percentage, check the consistency and sustainability of dividend payments.
Also Read: Do You Want to Become a Successful Investor? Learn These 7 Habits
5. Debt-to-Equity (D/E) Ratio
The D/E Ratio shows how much of the company’s operations are financed by debt vs. equity. It indicates the company’s financial leverage and reliance on borrowing.
A D/E Ratio > 1 means the company relies more on debt, which can be risky in uncertain times. A D/E < 0.5 implies low debt, indicating a more stable and secure financial structure.

Example:
When analyzing this ratio, also consider the company’s sector and growth plans. If a company borrows to fund major expansion, the D/E may rise—but its ability to repay debt must also be assessed.
Thus, D/E not only reflects debt levels but also the financial equilibrium and risk management of a company.
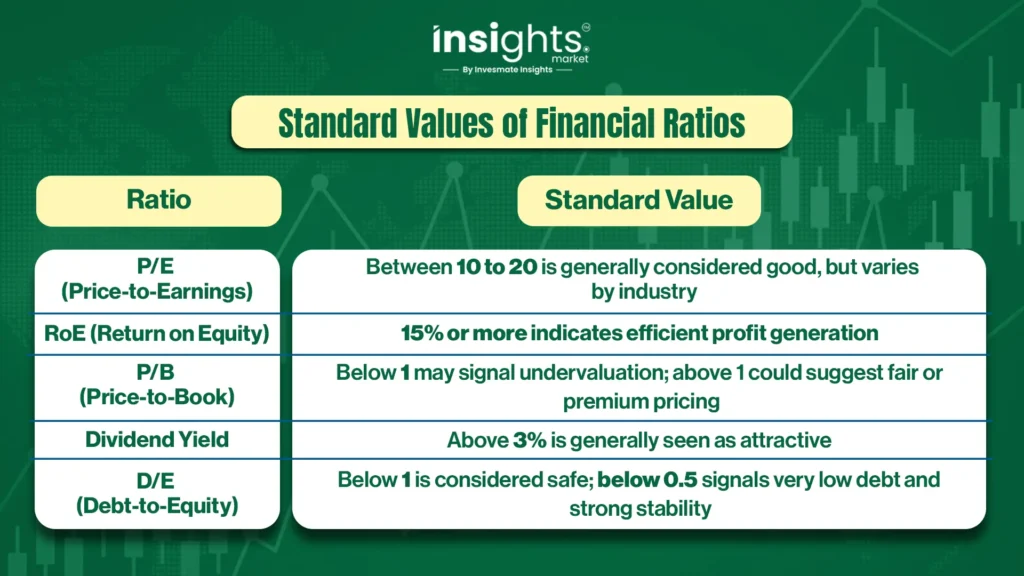
Standard Values of Financial Ratios
Practical Investment Tips
- Never rely on just one ratio—look at a combined analysis of multiple indicators
- Always perform peer comparisons within the same industry
- Reassess the ratios after every quarterly result
- Besides ratios, evaluate the business model, management quality, and growth prospects
Also Read: Making Online Transactions? Follow These 10 Tips to Stay Safe from Scams
Conclusion
Financial ratios are powerful tools for every informed investor. They help decode a company’s profitability, valuation, debt burden, and overall financial health.
- P/E Ratio reveals if the price is justified
- RoE shows return efficiency
- P/B Ratio compares price to asset value
- Dividend Yield reflects passive income potential
- D/E Ratio uncovers debt dependency and risk
These five ratios form the foundation of sound investment decisions.
Remember: In the world of investing, logic and analysis should always take precedence over emotion and hearsay. Don’t follow the crowd blindly—make research-based decisions to increase your chances of long-term success.
FAQs
From company annual reports, quarterly results, or platforms like Screener.in, Moneycontrol, Ticker Tape, etc.
Yes. Different sectors have varying capital structures. For example, banks naturally have high D/E ratios.
Yes. Market sentiment, frauds, geopolitical risks, or business collapses can affect performance. Diversification is key.
Not necessarily. A high P/E might indicate strong growth—or overvaluation. Always compare with industry peers.
EPS is used in calculating P/E Ratio and shows profit per share. Higher EPS usually indicates higher earnings.
Not always. Startups often lack stable profits or dividends. Evaluate growth potential and business model more.
This happens when shareholders’ equity is negative—usually due to prolonged losses. Such companies should be avoided.