
![]()
Do you often get confused — “Should I buy now or wait?” Or maybe you wonder, “Why am I losing in almost every trade?” You might be spending time in the stock market, but still struggling to understand why prices rise or fall. The main reason behind this confusion and wrong decisions is the lack of a planned strategy.
Many traders trade purely based on emotions or rumors without having a clear strategy. In such cases, the only way to make the right decision is by using a reliable, analytical tool — and that’s where Technical Analysis becomes so important.

Technical Analysis is a powerful tool that helps predict future market movements by analyzing price charts.Whether you’re trading stocks, crypto, forex, or commodities, learning Technical Analysis will improve your trading skills and make every step more informed.
In this blog, you’ll learn what Technical Analysis is, why it’s important, and how you can master it step by step — even if you’re a complete beginner.
What is Technical Analysis (TA)?
Technical Analysis is a method of analysis where past market data—especially price and trading volume—are used to predict the future movement of an asset. This is different from Fundamental Analysis, which primarily studies a company’s financial aspects such as revenue, profits, and debt.
The core belief of Technical Analysis is: “All market information is already reflected in the price.”
In other words, by looking at price movements on a chart, we can understand market emotions—such as fear, greed, or momentum. Therefore, analyzing a chart does not just mean looking at price; it is also a powerful way to interpret overall market sentiment.
Step-by-Step Guide: How to Learn Technical Analysis
1. Start with the Basics
The first step is to understand how price charts work. A chart shows how an asset’s price has moved over time, which helps identify future trends.
Key elements of a chart:
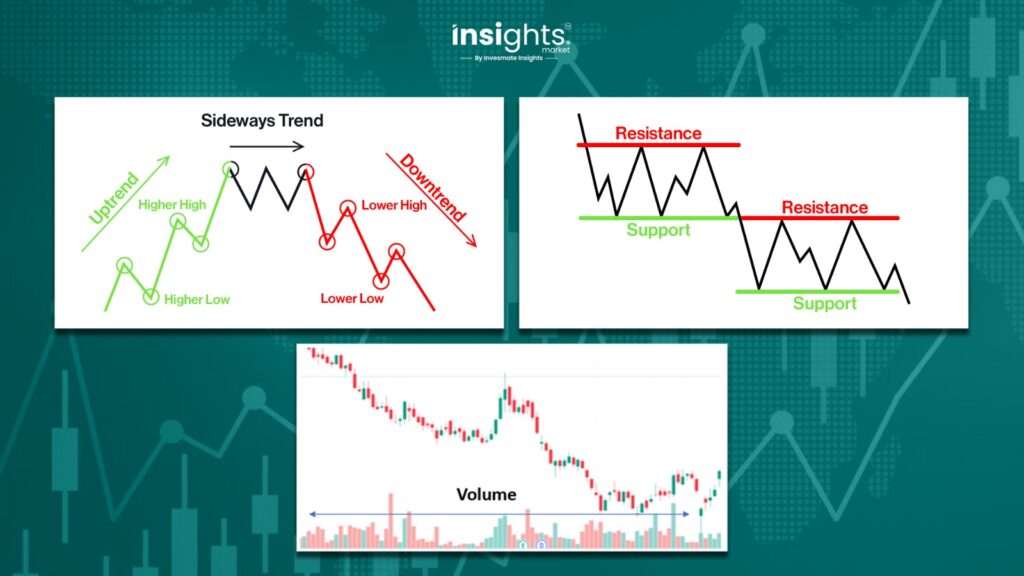
- Trend: Shows the direction of price (Uptrend, Downtrend, or Sideways).
- Support: The price level that acts like a “floor” where prices usually stop falling.
- Resistance: The “ceiling” level where prices struggle to rise further.
- Volume: Shows how many units were traded in a given time. High volume usually signals strong moves.
Types of Price Charts:
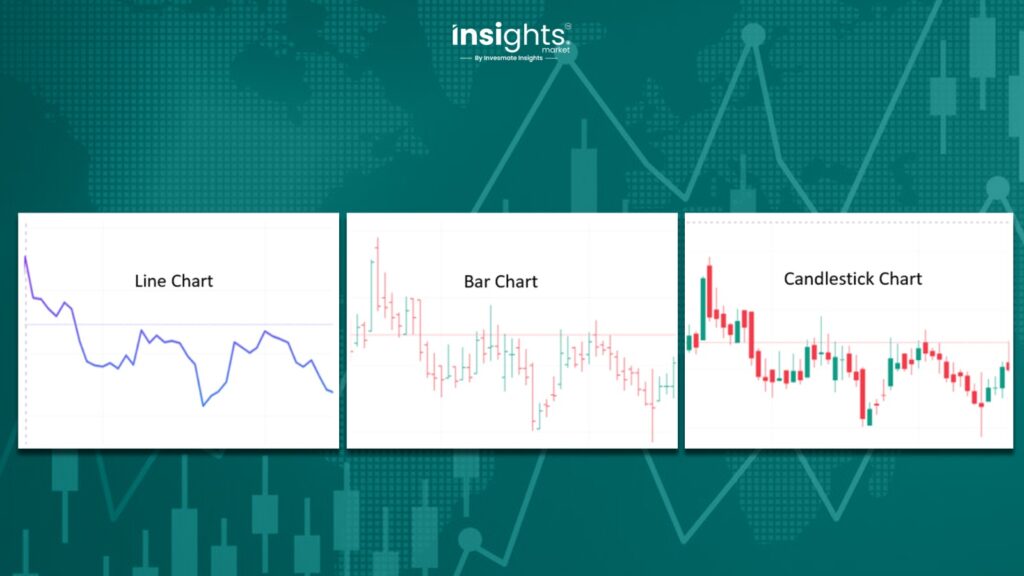
- Line Chart
This connects the daily closing prices with a straight line. It is easy to understand for beginners and helps in identifying overall trends. - Bar Chart
Displays the Open, High, Low, and Close (OHLC) for a specific time period. It provides more detailed information and is highly effective for analyzing price movements. - Candlestick Chart
The most popular and widely used chart type. It presents OHLC data in a visually descriptive way, helping traders understand buyer and seller sentiment. It is very effective in identifying both trend reversals and trend continuations through price action.
Each candlestick represents how the price moved within a specific time period. Based on its color and shape, traders can interpret the underlying market sentiment.
- Green Candle: Forms when the closing price is higher than the opening price. This indicates that buyers had control during that period.
- Red Candle: Forms when the closing price is lower than the opening price. This suggests stronger selling pressure.
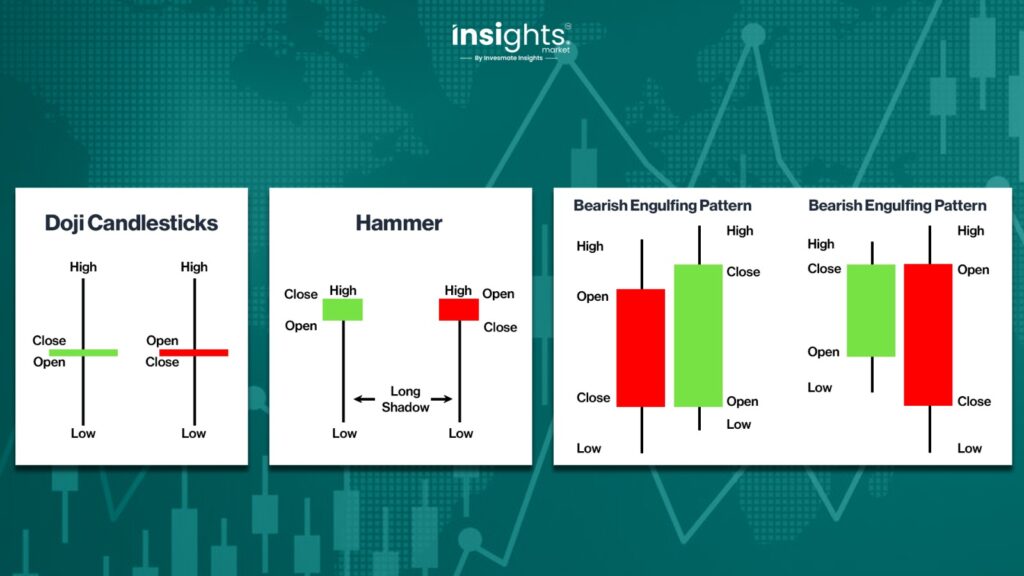
Apart from color, the shape and structure of a candlestick are also crucial:
— Doji: Signals indecision, where the opening and closing prices are almost the same.
— Hammer: Has a long lower shadow, often indicating a potential trend reversal.
— Engulfing: When a candle completely engulfs the previous one, giving a strong reversal signal.
By learning these different candlestick formations, you can more easily identify trends and anticipate potential market reversals in advance.
Also Read: Making Online Transactions? Follow These 10 Tips to Stay Safe from Scams
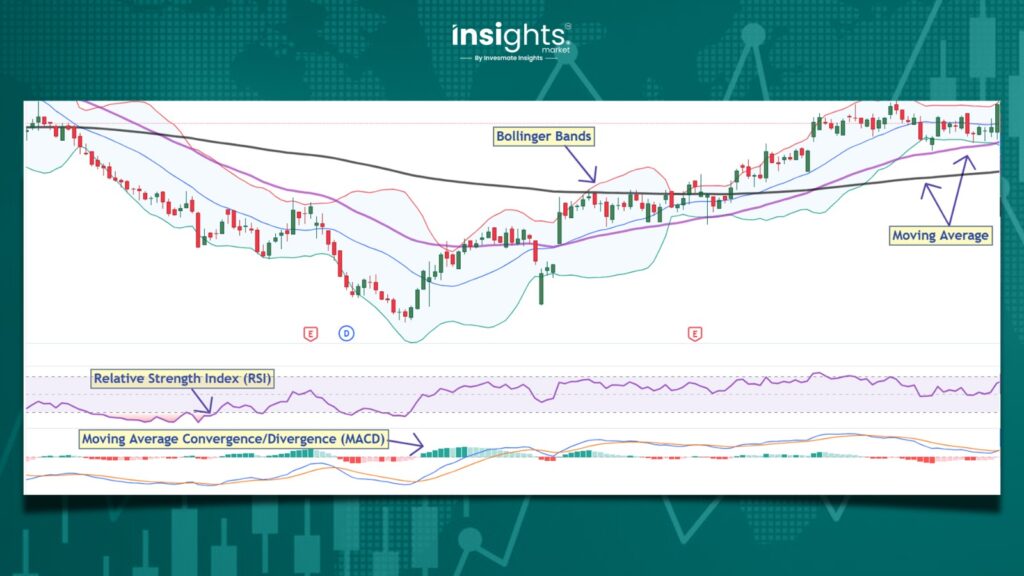
2. Learn About Technical Indicators
Indicators are mathematical calculations based on price and volume that help identify trends or reversals.
Popular Technical Indicators:
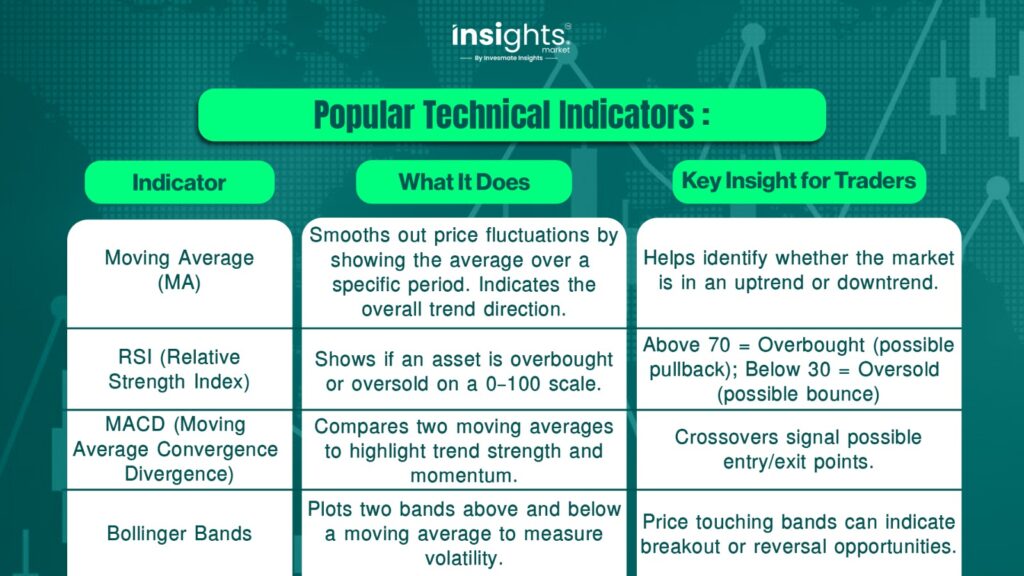
With just 2–3 of these indicators, you can get a clear understanding of the market’s trend, momentum, and condition—making your trading decisions more accurate and confident.
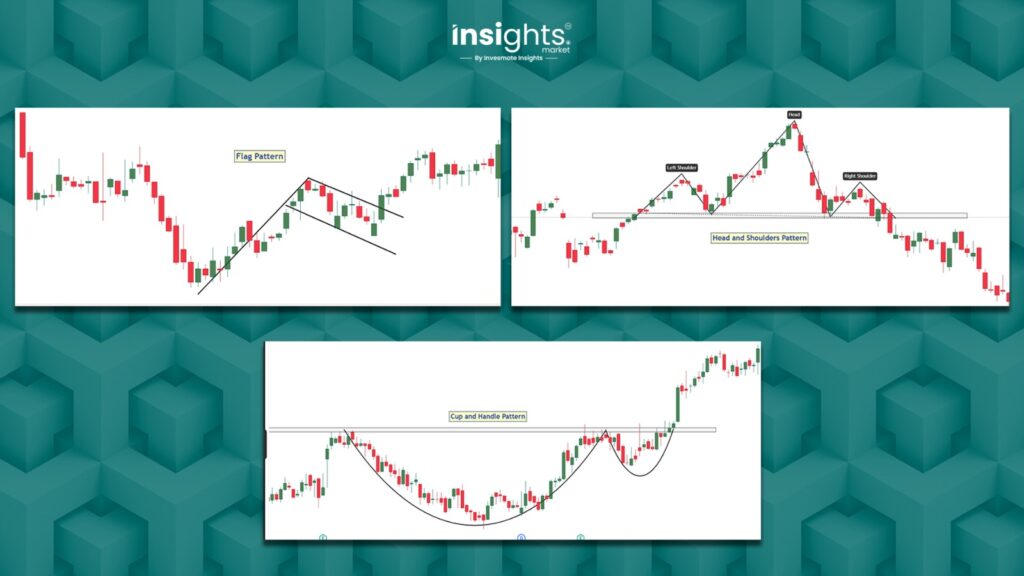
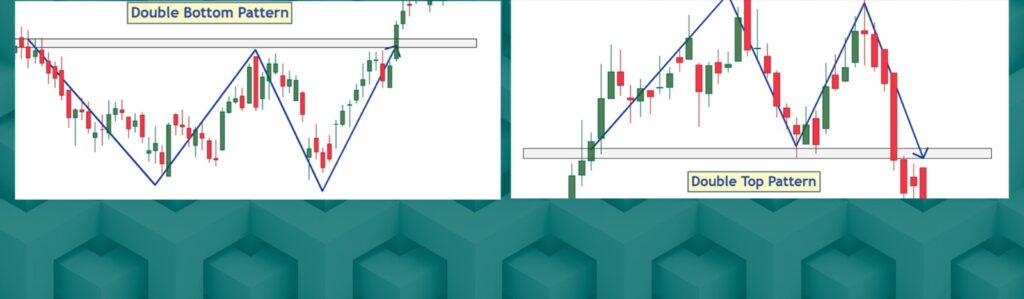
3. Understand Chart Patterns
A Chart Pattern is a specific type of price fluctuation that appears repeatedly in the market and helps predict future trends. By analyzing these patterns, traders can easily identify potential entry and exit points.
Some Common Chart Patterns:
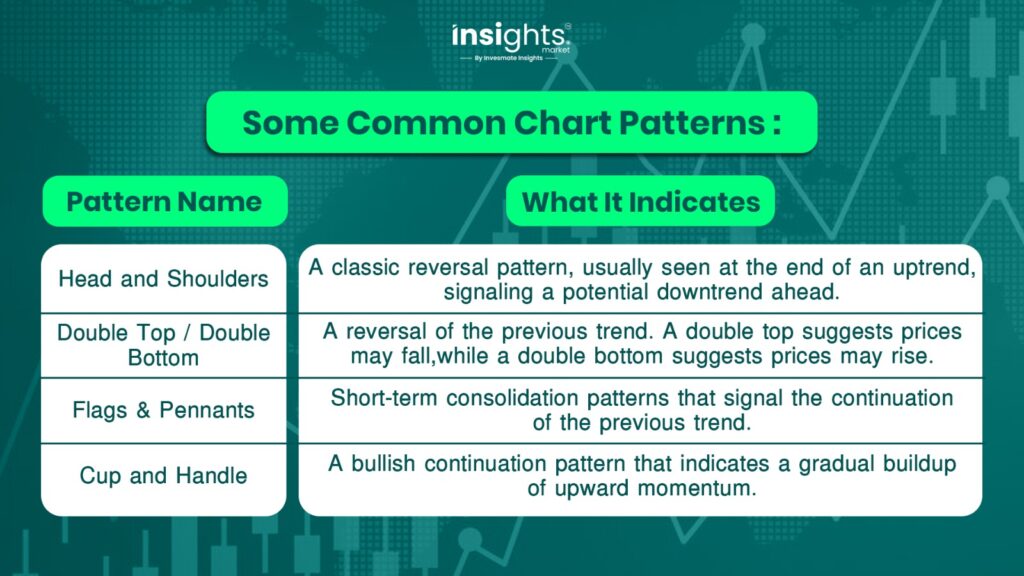
Having an understanding of such chart patterns allows you to grasp market momentum more effectively and make profitable decisions at the right time.
4. Use Online Learning Platforms
In today’s digital era, learning Technical Analysis has become easier and more convenient than ever, thanks to the availability of numerous reliable learning platforms on the internet.
Popular Online Platforms to Learn Technical Analysis:
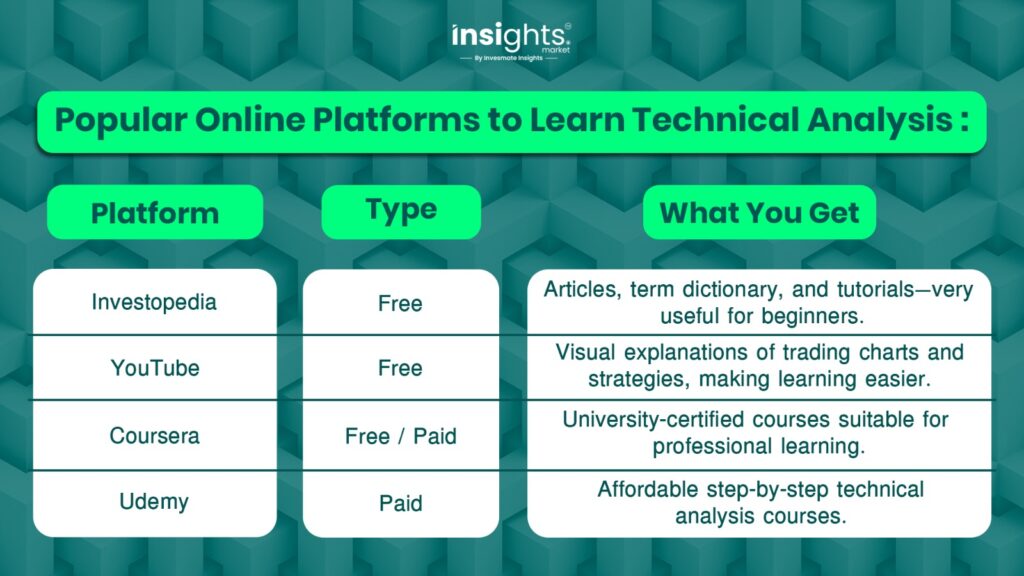
You can also join Telegram or Discord groups for real-time updates.
Also Read: PO, FPO & OFS: Your Complete Guide to Seizing the Right Market Opportunities
5. Practice with Demo Accounts
Reading books is not enough — you must practice!
With paper trading or demo accounts, you can trade with virtual money without any financial risk.
Benefits of Demo Trading:
- No money risk
- Real market environment
- Builds emotional discipline
Demo accounts are available on platforms like TradingView, Zerodha, Upstox, and Fyers.
6. Use Trading Tools & Software
To perform Technical Analysis effectively, using good charting software is extremely important.
Some of the widely used software includes:
- TradingView
A popular web-based charting platform that provides real-time charts, a wide range of indicators, stock screeners, and custom alerts. It is suitable for both beginner and experienced traders.
- ChartIQ
A simple and beginner-friendly charting interface, mainly designed for new traders to help them learn basic analysis.
- Zerodha Kite
One of the best broker platforms for trading in the Indian stock market. It offers both TradingView and ChartIQ charting support, making analysis much easier.
With these, you can also backtest strategies and even use auto-trading.
Also Read: Do You Want to Become a Successful Investor? Learn These 7 Habits
7. Read Books & Blogs
Some classic TA books worth reading:
- Technical Analysis of the Financial Markets — John Murphy
- Japanese Candlestick Charting Techniques — Steve Nison
- Encyclopedia of Chart Patterns — Thomas Bulkowski
- How to Make Money in Stocks — William O’Neil
Also, stay updated by reading blogs.
In that case, you can visit the our Invesmate Insights blog page through this link: https://blog.insights.market/
Beginner Tips
- Don’t try to learn everything at once — take it step by step.
- Use price action along with 2–3 indicators.
- Avoid emotional trading — stick to your rules.
- Keep a trading journal.
- Don’t panic over losses — focus on strategy.
Also Read: Are You Trading Too Often? Beware the Dangers of Overtrading!
Conclusion
At first, learning Technical Analysis may seem a bit difficult, but by following a step-by-step approach, you can easily master it. Learn to read charts, recognize patterns, use indicators, and gradually build your own strategy.
The most important factors are patience and regular practice. Always remember: “Consistency is key — not perfection.”
FAQs
Learn 1 new concept daily, analyze 3 charts, and review your learning weekly.
Use multiple confirmations — price action, volume, and at least 2 indicators.
Yes! Apps like TradingView or YouTube tutorials make it easy.
No, it works for swing trading, positional trading, and even long-term investing
Price Action is the foundation. Indicators only confirm signals.
Basics can be learned in 2–3 months with regular study, but expertise requires continuous practice.
The information provided in this reference is for educational purposes only and should not be considered investment advice or a recommendation. As an SEBI-registered organization, our objective is to provide general knowledge and understanding of investment concepts.
It is recommended that you conduct your own research and analysis before making any investment decisions. We believe that investment decisions should be based on personal conviction and not borrowed from external sources. Therefore, we do not assume any liability or responsibility for investment decisions made based on the information provided in this reference.