

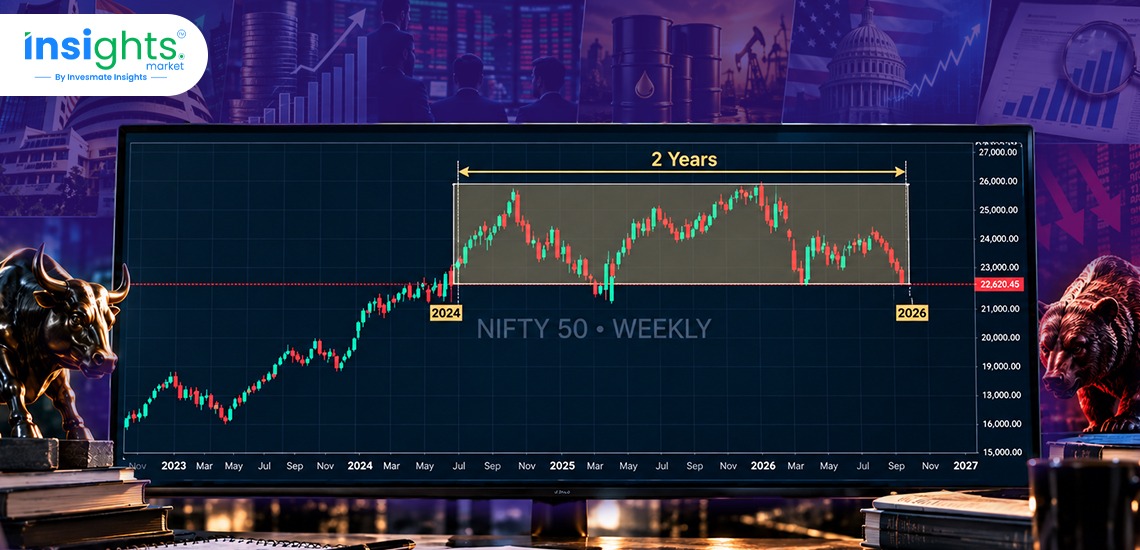

The Indian equity market has delivered a rather unusual experience over the past two years. NIFTY 50 touched a record high of around 26,277 in September 2024, corrected sharply, recovered, and reached another record high of around 26,340 in January 2026, only to come under pressure again. Despite these multiple highs, investors who entered around the September 2024 peak have seen limited overall returns after a period of significant volatility. Institutions have described this phase as a “two-year round trip,” where the market moved through multiple rallies and corrections but ultimately delivered flat-to-negative returns.
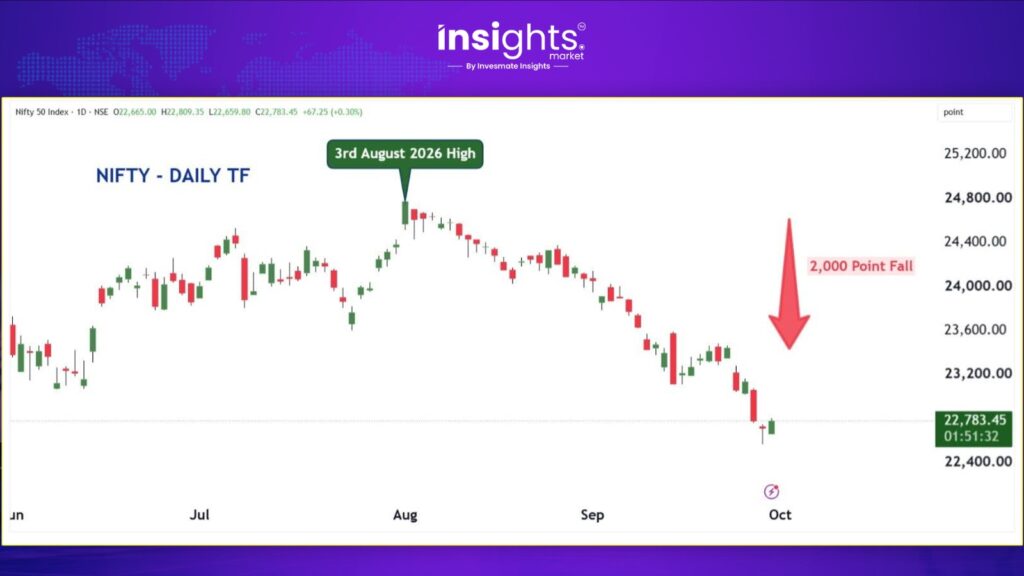
The more important development, however, is the sharp correction seen over the last two months. The market has moved from a prolonged period of sideways movement into a phase of broader selling, with large-caps, mid-caps and small-caps all facing pressure. This raises a key question for investors: What has changed after the latest market high?
Historical Periods of Limited NIFTY Returns
Historically, NIFTY has gone through several phases where two-year returns remained close to flat. The table below highlights these periods and shows how the market performed over the following one and three years.
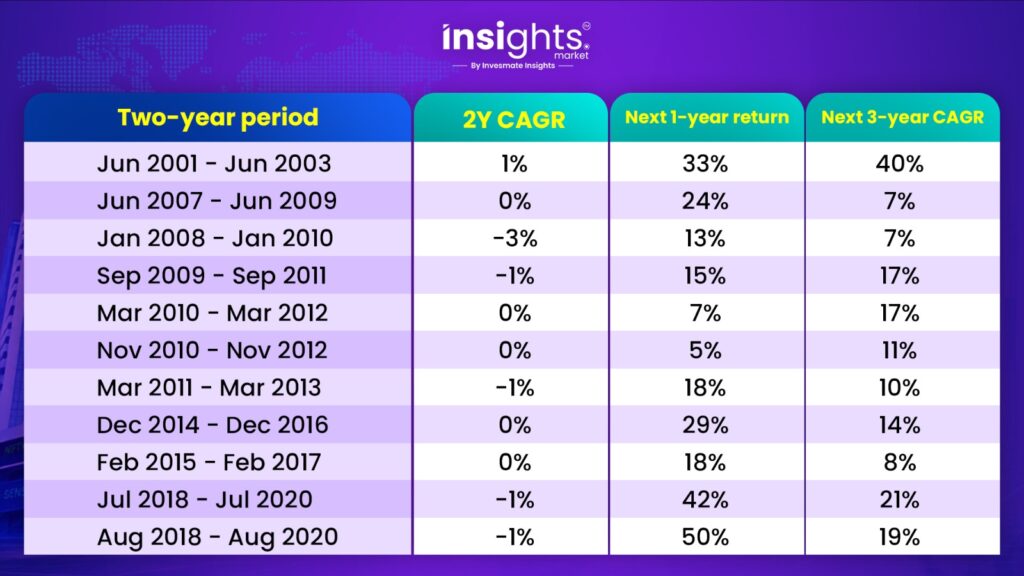
The key question now is whether the recent correction is a consolidation phase or reflects bigger changes in earnings, valuations, and liquidity.
Why Has the Recent Correction Become Sharper?
The current decline is different from the earlier sideways phase because selling pressure has become broader and faster. During the September 2026 series, NIFTY fell around 6.7%, while Bank Nifty fell around 5.7%. Foreign investors sold approximately $2.7 billion in India’s spot market during September and increased their short positions in index futures. The correction has also spread beyond large-cap stocks. Mid-cap and small-cap indices have joined the decline, suggesting that the current weakness is broader than just a few index-heavy companies. This shift from sideways movement to broad-based selling is one of the most important changes investors need to monitor.
External Factors Are Adding Pressure
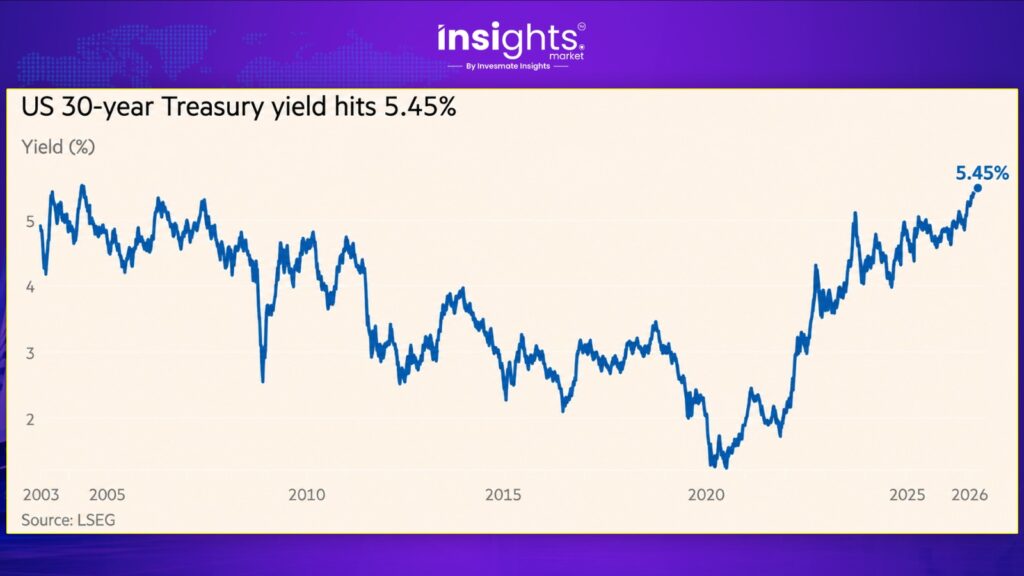
Higher Global Bond Yields: Global bond yields have become an important source of pressure. The US 10-year Treasury yield moved above 5.27%, reaching its highest level since 2007. Higher yields can influence global capital allocation and make emerging-market equities more sensitive to foreign outflows.
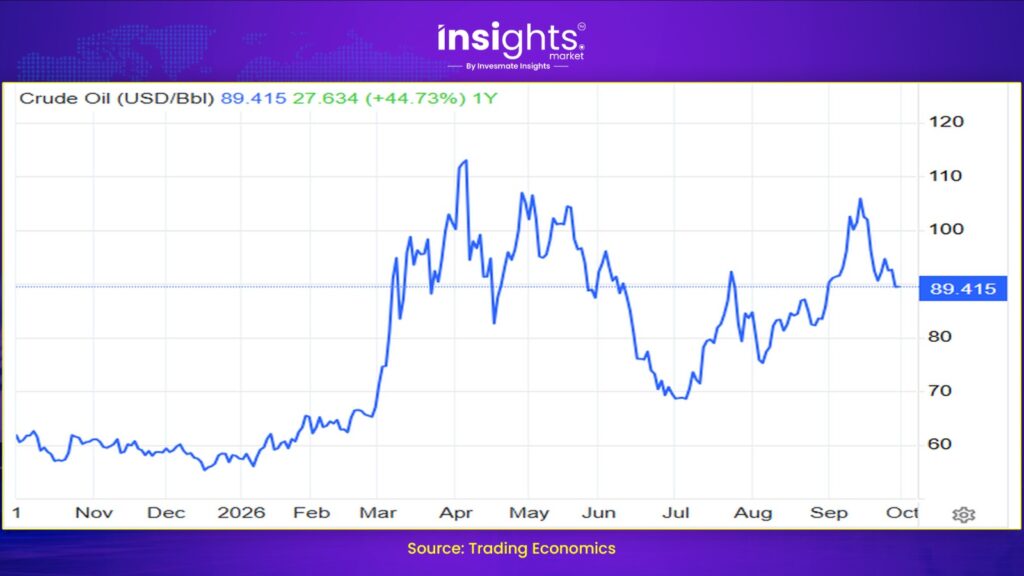
- Crude Oil: Brent crude has remained around $90 per barrel. For India, sustained high crude prices can increase pressure on the import bill, inflation, the rupee, and corporate margins.
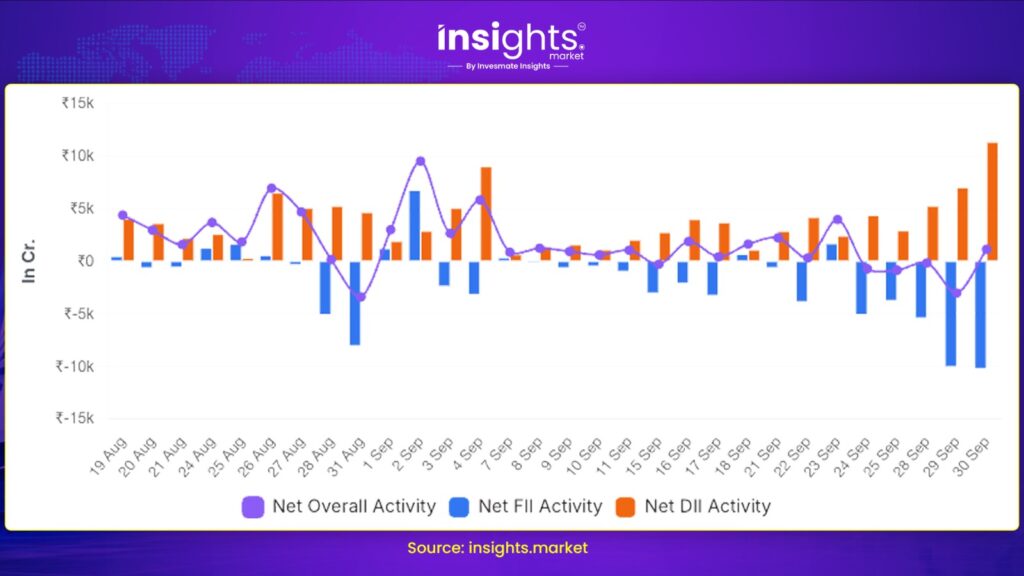
- Foreign Investor Selling: FII selling has become another major factor. The combination of relatively high Indian valuations and attractive opportunities in other markets has affected foreign capital flows. September’s selling also coincided with a significant increase in short positions in index futures.
- Geopolitical Uncertainty: Geopolitical developments such as West Asia conflicts have added another layer of uncertainty, particularly through their impact on crude oil prices and global risk appetite. This has made investors more cautious towards emerging-market equities.
Internal Factors Behind the Correction
While global forces dictate the mood, domestic realities dictate the actual valuation multiples. The internal mechanics of the market have shifted substantially over the past quarter.
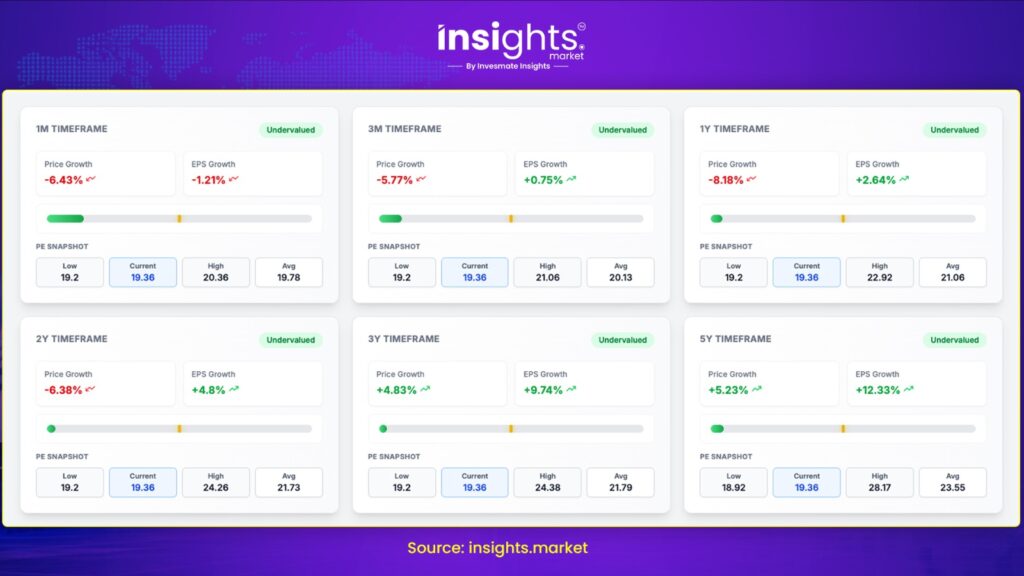
- Earnings Growth & Valuation: Over the past 2 years, NIFTY 50’s EPS growth was only 4.88%, while price growth was -6.85%. The relatively modest earnings growth has kept market expectations measured, as investors have not been willing to assign significantly higher valuations without stronger earnings support. Before the correction, NIFTY 50 valuations had moved ahead of forward earnings expectations. Following the sell-off, the index is trading at around 19.2x P/E, bringing valuations closer to 5-year lows. This gap between earnings growth and market expectations has also contributed to the recent valuation adjustment.
- Sector Rotation: The underlying capital flow indicates a distinct defensive shift, with investors moving away from aggressively valued growth sectors. Banking is facing pressure from slower credit growth and renewed asset-quality concerns, while IT continues to face sluggish global discretionary demand and prolonged deal cycles. Auto is dealing with moderating volume growth and margin pressure, FMCG faces tepid rural demand and higher input costs, and Pharma is navigating US generic pricing pressure and tariff issue, while Metals remain sensitive to global commodity cycles and China’s economic data.
Price Correction or Time Correction?
The last two years have characteristics of a time correction, while the recent two-month decline has added a stronger price-correction element. A time correction occurs when stock prices remain relatively subdued while corporate earnings gradually catch up.
A price correction occurs when stock prices fall to adjust valuations. The current market therefore needs to be analyzed through both lenses. If earnings remain resilient while prices stay below their earlier highs, the market may gradually adjust through time. If earnings growth also weakens, the correction could have a stronger fundamental component.
What Should Investors Watch Now?
The next phase of the market will depend on several factors:
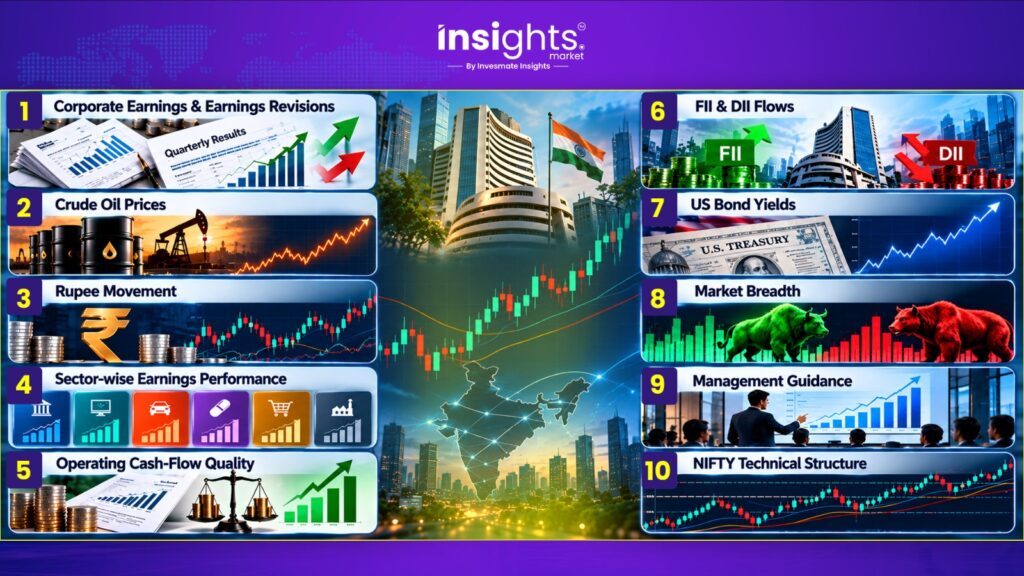
Investors should also monitor whether the market weakness remains concentrated in specific sectors or continues to spread across the broader market.
Conclusion
The current market correction is not simply a story of NIFTY falling after a recent high. It is the latest phase of two years in which the index has made multiple attempts at new highs but generated limited overall returns. The September 2026 correction has added a new dimension, with broader selling, significant FII outflows, elevated crude prices, and higher global bond yields creating additional pressure. For investors, the key question now is not only how much NIFTY has fallen, but also whether corporate earnings, cash-flow generation, and management guidance remain strong enough to support valuations after the correction. Two years of limited returns explain the broader market cycle. The sharp two-month fall tells us that something has changed in the near-term environment. The next few quarters of earnings will be important in determining whether this remains primarily a valuation and sentiment correction or develops into a broader earnings-led adjustment.
FAQs
The recent correction has become broader and faster, with selling spreading across large-cap, mid-cap and small-cap stocks. FII outflows, higher global bond yields, elevated crude prices and geopolitical uncertainty have added pressure.
NIFTY 50 has made multiple attempts at new highs over the past two years, but the market repeatedly corrected after these rallies. As a result, the overall two-year return remained limited despite the index reaching new highs.
Over the past two years, NIFTY 50’s EPS growth was 4.88%, while price growth was -6.85%. This shows that earnings growth has been relatively moderate compared with the broader market movement during the period.
Following the recent sell-off, NIFTY 50 is trading at around 19.2x P/E, bringing valuations closer to historical levels.
Key external factors include higher US bond yields, elevated crude oil prices, FII selling and geopolitical uncertainty. These factors can influence global capital flows and investor risk appetite toward emerging markets.
The last two years had characteristics of a time correction, while the recent two-month decline has added a stronger price-correction element. The final outcome will depend partly on how earnings perform while prices remain below their earlier highs.
Investors should track corporate earnings, cash-flow generation, management guidance, FII/DII flows, crude oil prices, global bond yields, market breadth and sector-wise earnings performance to understand whether the weakness remains valuation-driven or becomes more earnings-led.
No. Historical periods of near-zero two-year returns provide context rather than a prediction. The subsequent market performance has varied across different periods, so the current correction needs to be evaluated based on present earnings, valuations and liquidity conditions.
This article is for educational and informational purposes only. It is not investment advice or a stock recommendation. Investors should conduct their own research or consult a qualified financial advisor before making investment decisions.